In the previous article, we’ve half-opened how we use the DVC tool for our ML experiments. Of course, it’s not the only one of its kind on the planet Earth.
We can name at least three other commonly used tools:
GitHub. Being both proprietary and open-source (depending on the repository), this platform is popular for version control, code collaboration, and project management. While primarily focused on source code, it can also handle data versioning. GitHub is exceptionally effective for collaborative software development, allowing teams to coordinate changes, review code, and manage issues. At the same time, it also supports data-related projects through repositories and integration with other tools.
MLflow. This open-source end-to-end machine learning platform includes model versioning, experimentation tracking, and model deployment. It manages machine learning workflows by capturing experiment parameters, code, and dependencies. The toolset enables teams to reproduce and share results seamlessly across different stages of the model lifecycle.
LakeFS. The tool is an open-source data versioning framework for data lakes. It provides version control and data lineage capabilities for large-scale data sets stored in object storage systems like Amazon S3. LakeFS works great at managing and tracking changes to data in data lakes, ensuring data quality and reproducibility in collaborative data-intensive projects.
No need to say the choice of tool depends on specific use cases, conditions, and requirements.
Here are a few factors you can rely on when picking up the data versioning instrument for your company:
- Scalability and performance. The chosen data versioning tool is supposed to handle the scale of your data and provide efficient performance. The instrument should be capable of managing large datasets without compromising on speed, enabling seamless collaboration and data-intensive operations across the organization.
- Integration with existing workflow. Compatibility with your existing technology stack and workflow is essential. The toolkit should seamlessly integrate with your data processing pipelines, analytics tools, and storage systems, reducing disruptions and enhancing productivity throughout the data lifecycle.
- Collaboration and access control. Businesses can only succeed with robust collaboration features and granular access control mechanisms. The framework should support teamwork by enabling multiple users to work concurrently, tracking changes, and offering permissions management to ensure data security and compliance with data governance policies.
Anyway, you already know what tool stole our hearts. And we’d like to go on with our experiments.
Handling the training process
Now, we’re going to watch how DVC transforms the training process, simplifies version management, enables iterative enhancements, and contributes to more efficient and effective model development.
Setup
DVC allows us to run our scripts comfortably: manage all reproduction iterations, split all scripts into stages, manage all metrics and visualize interactive plots.
Let’s make a src folder for scripts that will perform: preparing data, training model, getting metrics, and visualizing plot.
First, we created a prepare.py file, which prepares the dataset for the training model, so it performs such steps: filling missing values, extracting name information to different columns, encoding boolean columns, encoding categorical values, splitting into train and test set, scaling them and then export these splits as .npy files that contain feature matrices for training model. Let’s also make a commit to these changes:

Then we created a stage for this script because it will perform separate work from other scripts, namely data preprocessing with this command:
dvc stage add --force -n prepare \
                -d src/prepare.py -d data/train.csv -d data/test.csv \
                -o data/prepared \
                python src/prepare.py data/train.csv data/test.csv
This command looks pretty big, so let’s break it down into what every keyword means:
- –force – means that we can make changes if this stage exists, but if not, just create it.
- -n – means the stage’s name; in our case, we specified -n prepare, so the stage’s name will be “prepare.”
- -d – means all paths to files or folders necessary for executing the script, so we do data preparation and need the script itself and dataset files.
- -o – means all paths to files or folders that are output from the script; in our case, we specified just a prepared folder in the data folder because all the preprocessed data will be exported there.
- And the last line means the command with how our script will execute, so it will “write” this command to the terminal and then run to get results.
All next stages will have a similar structure, so in the following steps, we will describe only some unique cases if necessary.
Let’s check how our script works by doing this command:
dvc repro

As we can see, the script has performed as we specified in the “prepare” stage, and it also printed train and test shapes as it was in the code. Now the file tree will look like this:

So, we have prepared .npy files with feature matrices, and as you noticed, DVC created dvc.lock and dvc.yaml files. The first one is used for tracking changes via git, and the second one is used for storing information about all stages and plots that will be reproduced with the dvc repro command. The structure of dvc.yaml looks like this:

So, now it only contains information about the “prepare” stage in the “stages” we specified above. It will contain information about the following stages and plots in the future.
After creating the “prepare” stage, we created a train.py file in the src folder containing code for model training.
This script accepts train files with feature matrices(X_train.npy and y_train.npy), trains the model (in our case Logistic Regression) using GridSearch with KFold, and then exports the model in .pkl format to evaluate it in the next stage to get metrics with the plot.
We made stage “train” with the following command:
dvc stage add --force -n train \
                -d src/train.py -d data/prepared/X_train.npy -d data/prepared/y_train.npy \
                -o model.pkl \
                python src/train.py data/prepared/X_train.npy data/prepared/y_train.npy model.pkl
We specified the training script, X_train, and y_train matrices as dependent files. As output, we identified the model.pkl file and. The end of the command defines how this script will execute from a shell.
After executing the command, we see that the yaml file was changed. It also contains information about the “train” stage:

Let’s run dvc reproduce to see how “reproduce” works with 2 stages:
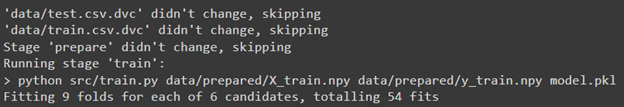
As we can see, DVC skipped cached data files because it hasn’t changed and the “prepare” stage because it’s unnecessary to rerun it when we already have the preprocessed data. The script executed successfully, so as a result, we have a file that contains the fitted model, and our file tree looks like this:

We can also commit these reproduce with such a command:

In addition to this, DVC allows us to paint a project diagram that describes its structure with this command:
dvc dag

As we can see as input, we have train and test files, and then it performs the “prepare” and “train” stages. Also, there is a gender_submission.csv.dvc file that is not used was also included in the diagram.
Also, we created an evaluate.py file in the src folder for evaluating the model and getting metrics results.
This script takes a file with a model as input to make predictions, then calculates accuracy, weighted precision, and weighted recall. It also makes a plot file with a confusion matrix.
For this script, we created a separate “evaluate” stage:
dvc stage add --force -n evaluate \
  -d src/evaluate.py -d model.pkl -d data/prepared \
  -M eval/live/metrics.json -O eval/live/plots \
  python src/evaluate.py model.pkl data/prepared/X_test.npy data/prepared/y_test.npy
It looks similar to other stages in the project. Still, there are some differences:
- -M – means that as an output file, we will also have a particular metrics file containing all metrics we calculated in the code. Hence, it needs to specify this separate key argument.
- Keywords with uppercase letters mean that these files will not be cached because we will do a few iterations to improve model metrics, so it needs to be changed after each running of dvc repro, and that’s why we specified them in such a way.
After making the stage let’s reproduce all the steps to get metrics and then visualize the confusion matrix:
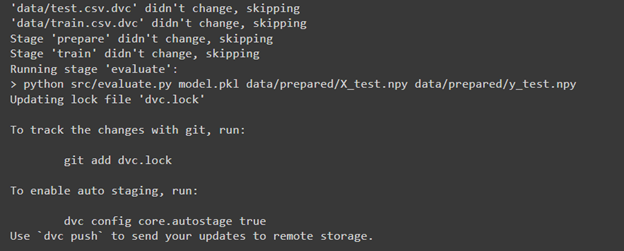
In the result, we skipped the “prepare” and “train” stages and performed the “evaluate” stage.
DVC allows us to show our metrics and plots in quite a beautiful way, so firstly, let’s see the metrics results that we got with this command:
dvc metrics show

As we can see with Logistic Regression, we have pretty good results and can visualize a confusion matrix. To do this, we need to modify the dvc.yaml file with this text at the end of the file to be able to generate the visualization file:
plots:
  - confusion_matrix:
      template: confusion
      x: actual
      y:
        eval/live/plots/sklearn/cm/confusion_matrix.json: predicted
So we make section “plots” which contains confusion matrix and axises x and y so that x will be called as actual. Y will include data from confusion_matrix.json, which was created in evaluate.py and will be named as predicted. As a result, it should look like this:

Let’s get a visualization of the confusion matrix with this command:
dvc plots show

As a result, we got an URL with a confusion matrix; also, it is located as a .html file in the dvc_plots folder. In our case, we just downloaded this file and opened it in a browser:
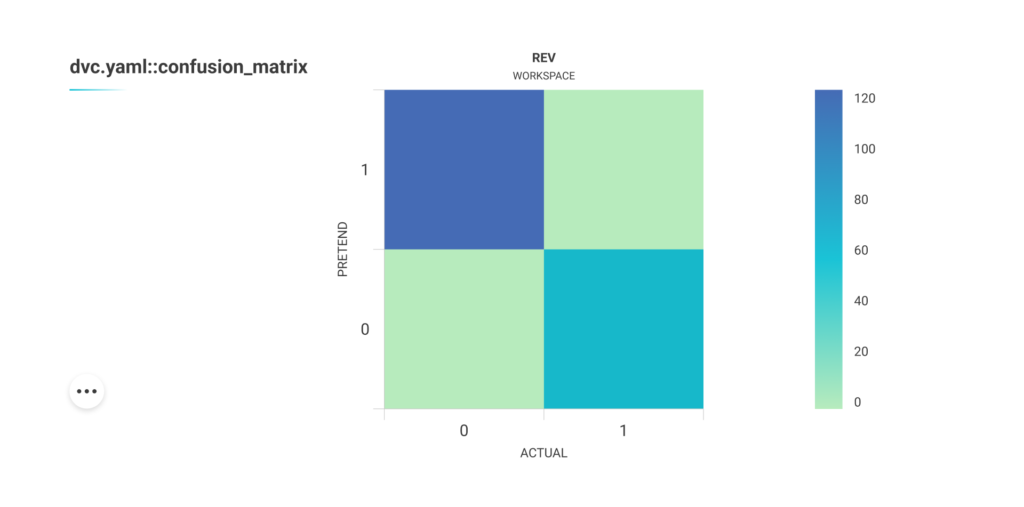
As we can see, this HTML page contains a confusion matrix plot. It’s pretty dynamic because if we move the cursor to one of the squares, we will see the number of samples that belong to this part of the matrix:

Also, some other interactions can be done with this plot by clicking on the 3 dots button:

Experiments to improve results
Let’s improve our results using another model with the same techniques. Before this, we’ll make a commit to comparing outcomes in the future with this command:

So we changed our code to train Random Forest. Also, we did dvc repro again and then committed results with this command:

As a result, we got the following outcomes:

It looks worse than with Logistic Regression, and we can also make the difference between 2 reproduces that we’ve done with this command:
dvc metrics diff
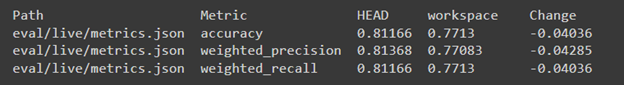
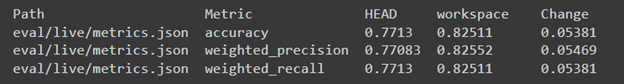
As we can see, HEAD is our previous commit with evaluation results that we made (Logistic regression evaluation stage), and workspace is a reproduction that we did, but it’s not committed yet. Also, it indicates the difference between metrics, which means that the result became worse than with Logistic Regression by approximately 4 percent. In addition, we can make plots different with the following:
dvc plots diff
So, it will look in quite a similar way as metrics diff.
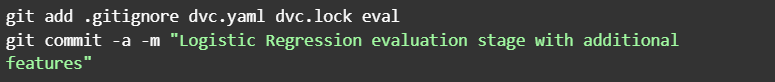
We also committed these results as we did with Logistic Regression to compare them to the next experiment, which is to reproduce the best model (in our case Logistic Regression) with additional features, so we changed train.py back to code with Logistic Regression and also prepare.py to add new features to the dataset.
In this script, we added ‘FamilySize’ to represent the size of the passenger’s family onboard and ‘IsAlone’ to check if the passenger is traveling alone. After doing repro, we received the following results:

As we can see, it became better than it was. Let’s make a difference to see how it changed:
As a result, we see a comparison between Random Forest and Logistic Regression with additional features because the latest commit is with Random Forest evaluating. But let’s better compare Logistic Regression with other features and Logistic Regression without additional features to see how it affects results. To do it, let’s commit to our current development:
DVC allows us to make a difference for exact commits; so when doing dvc metrics diff, we can additionally provide commit ids to make the comparison for chosen reproduces, so in our case:

This commit will have id: d338cfd, which works for all commits. So we used this command with ids to compare Logistic Regression with additional features and Logistic Regression without other features:
dvc metrics diff bc9da56 d338cfd
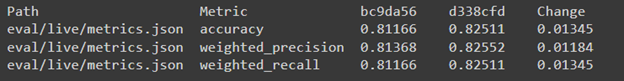
As we can see from this comparison, additional features increased all metrics by approximately 1 %. Also, there is a plot difference:
dvc plots diff bc9da56 d338cfd
Conclusion
As we can see, DVC makes the separation of scripts into stages very convenient, making experiments more structured. It’s also great for displaying metrics and graphs and comparing them between revisions. The only downside here is that to generate a chart, you need to navigate to a specific file and add a particular code to make it work.
To Sum Up
Upon running the experiment on using DVC (Data Version Control) and applying the Titanic – Machine Learning from Disaster dataset using several machine learning models and data science techniques, the tool demonstrates the following capabilities and pitfalls:
Version control for data and models. DVC provides an excellent solution for version-controlling data and models. Separating code, data, and model artifacts enables easy collaboration, reproducibility, and tracking of changes over time. This is especially valuable in data-intensive projects where multiple team members work on different components simultaneously.
Reproducibility and traceability. The tool helps ensure the reproducibility of experiments by managing dependencies between data, code, and model versions. It allows you to track the entire lifecycle of a model, making it easier to identify the exact data and code used to train a particular model. This traceability is crucial for research, auditing, and debugging purposes.
Scalability. DVC efficiently handles large datasets and models by adopting a pointer-based approach, only storing references to data and models rather than duplicating them. This makes it suitable for projects with big data and resource-intensive models.
Integration with existing tools. The DVC toolkit seamlessly integrates with popular version coding systems like Git. It does not require significant changes to the existing codebase and workflow, making it easy to adopt in most development environments.
Collaboration and sharing: The instrument facilitates collaboration among team members, allowing them to work simultaneously on different project parts without stepping on each other’s toes. Additionally, sharing experiments and results with other researchers or stakeholders becomes simpler.
Complexity and learning curve. DVC adds an extra layer of complexity to the development process. Learning and integrating DVC into the workflow might require some initial effort, particularly for teams unfamiliar with version control concepts.
Storage overhead. DVC’s pointer-based approach minimizes storage overhead but still introduces additional storage requirements. As projects scale and accumulate versions, this overhead may become a concern.
Continuous Integration and Deployment (CI/CD): DVC integrates well with CI/CD pipelines, automating the model training and making the deployment process more manageable.
Yes, using DVC to handle the model training process is highly beneficial, especially for projects with large datasets and multiple team members. It is a powerful tool for version control, reproducibility, and traceability of models that enhances collaboration and simplifies integration with existing tools and workflows.
Worth to note teams should be prepared to invest some effort in learning and adapting to the DVC framework at the initial stage. At the same time, DVC is valuable to data-centric projects seeking improved model management and experimentation.
We at Unidatalab are very enthusiastic about using different tools to increase the accuracy of our models and enhance their overall performance. Want to try how it works? Just drop us a line!